Business Intelligence Dashboard Development
A business intelligence dashboard is a custom web application that consolidates data from the systems your business already runs and turns it into interactive reports your team can drill into — and building one that people trust for decisions requires more than connecting a charting tool to a spreadsheet. It reports over your own data: it pulls numbers from your CRM, ERP, finance, and operational databases, integrates them into one reconciled view, and lets your team drill from a headline metric down to the transactions behind a decision.
This page covers BI and reporting dashboards specifically — data-warehouse-backed applications that refresh on a schedule and support descriptive and diagnostic analysis of what happened and why. Real-time streaming dashboards and AI or predictive analytics are separate builds, so we keep them out of scope here.
Business intelligence dashboard development for a mid-market company is production engineering, not report configuration. We build BI dashboards as a focused branch of our dashboard and analytics application development and broader custom web application development work — engineered to your data model, your source systems, and your access rules, not a chart pasted over a spreadsheet export. We build and integrate them as production software, so the dashboard stays trustworthy as your data and your teams grow.
The data flow below traces how a BI dashboard consolidates source systems through a data warehouse and OLAP model into drill-down reporting, with an embedded-analytics panel rendered inside a host application.
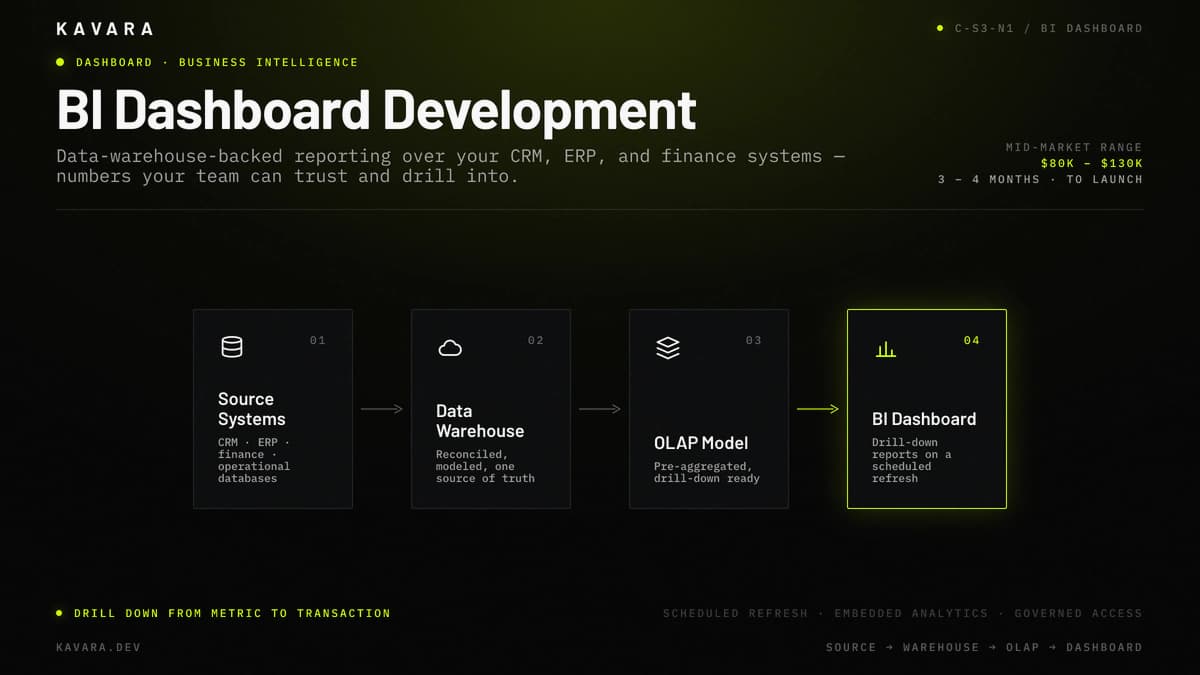
What Is a Business Intelligence Dashboard
A business intelligence dashboard is a secure, custom web application that consolidates data from multiple business systems into a single interactive interface where users can filter, drill down, and analyze metrics to support decisions. What makes it a BI dashboard is the data underneath: it reports on consolidated historical and current data — descriptive and diagnostic analysis of what happened and why — refreshed on a schedule from a data warehouse rather than streamed live. That scheduled scope separates it from a real-time monitoring dashboard, which streams live operational data, and from AI or predictive analytics — both separate builds. BI dashboards are one branch of our dashboard and analytics application development practice, alongside real-time monitoring and predictive analytics builds.
Companies build BI dashboards to replace static exports and disconnected spreadsheets with one governed, self-service surface where filtering and drill-down give every team the same numbers, cutting the manual work of hand-built reporting. A business intelligence dashboard sits as a reporting and analysis layer over the source systems you already run — CRM, ERP, finance, and operational databases — fed through a data warehouse, not a replacement for them; most business intelligence dashboard development effort goes into that consolidation layer, not the charts on top. Role-based access governs who sees which metrics and rows. What a BI dashboard must actually do for those users comes down to a specific set of analytical capabilities.
Core BI Dashboard Capabilities We Build
Every BI dashboard we build starts from the same core analytical capabilities, then adds the metrics and models a specific business needs. We build BI dashboards as production software, so each of these capabilities holds up under daily decision-making, not a demo that looks right once.
Drill-down analysis is the capability that makes a dashboard analytical rather than static: users move from a summary KPI down through dimensions — region to team to individual, or year to quarter to day — to the transactions behind a number. Drill-down is what lets the dashboard answer "why," not just "what."
An OLAP or semantic model is the pre-modeled analytical layer beneath those views — measures, dimensions, and hierarchies defined once so every metric is computed consistently everywhere it appears. That shared model is the difference between a report people trust and one they argue about in the meeting.
Interactive filtering and slicing let each user answer their own question — date ranges, segments, and dimension filters applied on the fly — without waiting on a new report request.
Scheduled reporting automates report generation and distribution by email, PDF, or data export on a set cadence, and threshold alerts flag a metric the moment it moves out of range.
Role-based access governs data at the row and metric level, so each user or department sees only the figures they are permitted to see. None of these capabilities work without trustworthy, consolidated data underneath them — which is why data warehouse integration is the foundation of the build.
Data Warehouse Integration and Source Consolidation
A BI dashboard is only as trustworthy as the data underneath it, so most of the engineering work is upstream of the charts — consolidating source systems into a single, governed analytical store. Source consolidation pulls from your CRM, ERP, finance, and operational databases into one data warehouse, so every metric is computed from the same reconciled numbers instead of from four conflicting exports.
Data warehouse integration depends on reliable pipelines. We build ETL or ELT pipelines that extract, transform, and load on a fixed cadence, with data-quality and reconciliation checks at each step so a wrong number never silently reaches a dashboard. Reliable refresh is what keeps a scheduled report worth reading.
The analytical model sits between raw sources and the dashboard: a data warehouse plus an OLAP or semantic layer is what makes fast drill-down and consistent metrics possible instead of slow queries against production systems. This data warehouse, pipeline, and OLAP layer follow the same web application architecture patterns we use across production systems, and data warehouse integration is core custom web application development work for analytics.
Data governance travels with the data — definitions, ownership, and access rules — so the dashboard is auditable and every figure traces back to a source. Once the data is consolidated and modeled, that same analytical layer can power reporting inside your other applications, not just a standalone dashboard.
Embedded Analytics and Application Integration
Not every BI dashboard lives on its own page — often the highest-value place for a report is inside the application your team already works in. Embedded analytics is BI reporting rendered directly inside another application — an internal tool, a customer-facing SaaS product, or a client portal — so users get insight in context instead of switching tools to find it.
We build embedded analytics on the same consolidated data warehouse and semantic model that feed the standalone dashboard. Embedded views are served through authenticated APIs, with the host application's identity and role-based access carried through, so a user only ever sees the data they are permitted to see inside that app.
Embedded analytics matters most in two places: customer-facing metrics inside a product your clients use, and operational reporting inside the internal app where the work happens. In both, embedded analytics turns reporting from a separate destination into a native, production-grade feature. Because those embedded views draw on the same model as the standalone dashboard, the numbers match everywhere. What a BI dashboard needs to report on — and how strictly it must be governed — changes sharply with the industry it serves.
Industry-Specific BI Dashboard Requirements
The core BI capabilities stay the same across industries, but the metrics that matter, the data sources, and the compliance demands do not. The same BI dashboard takes on different architecture depending on the sector it serves:
- Healthcare: A healthcare BI dashboard consolidates clinical, operational, and financial reporting from EHR and practice-management systems, with HIPAA-conscious access control and per-role data isolation over protected health information. It is a reporting layer with regulatory architecture layered on, so healthcare BI dashboards follow the same HIPAA-conscious architecture as the rest of our healthcare work.
- Financial services: A financial services BI dashboard centers on portfolio, risk, and compliance reporting over tightly governed access to sensitive financial data. Those portfolio, risk, and compliance reports are delivered as fintech reporting dashboards, built to SOC 2 and audit-ready logging standards.
- Operations-heavy industries: In logistics, manufacturing, and retail, a BI dashboard consolidates operational and ERP data into KPI and exception reporting — supply-chain, production, and inventory visibility that surfaces the outliers a team needs to act on.
Across every industry, the first question buyers ask is what a business intelligence dashboard costs to build.
How Much Does BI Dashboard Development Cost
A custom business intelligence dashboard typically costs $80,000 to $130,000 to build, with extensive data warehouse integration, OLAP modeling, or embedded analytics across multiple applications pushing toward the upper end of that range. Business intelligence dashboard development is priced on that engineering work, not on per-visual licensing math for a reporting tool, and the band reflects US production budgets for a dashboard teams actually run decisions on.
Five things move a BI dashboard budget within that range: the number and variety of data sources to consolidate, the complexity of the OLAP or semantic model, the number of distinct dashboard views, the number of user roles that need different data access, and whether analytics is embedded into other applications. For phase-by-phase budget allocation and how dashboards compare to other application types, see our application development cost breakdown.
Ongoing cost then runs roughly 15 to 25 percent of the initial build each year, covering hosting, data-pipeline maintenance, model updates, and the new reports and views teams ask for as they come to rely on the dashboard. Cost tracks closely with timeline, which is the next practical question.
How Long Does BI Dashboard Development Take
A custom BI dashboard typically takes 3 to 4 months from discovery to launch, depending on how many data sources must be consolidated, the depth of the OLAP model, and the number of dashboard views and user roles. A focused BI dashboard — one or two sources with standard drill-down and interactive filtering — reaches launch in about 3 months. A standard BI dashboard that adds data warehouse integration across several sources, scheduled reporting, and role-based access runs 3 to 4 months. A BI dashboard with heavy source consolidation or embedded analytics across multiple applications takes 4 months or more, approaching the analytics-platform range.
When Should You Build a Custom BI Dashboard Instead of Using Tableau or Power BI
Use Tableau, Power BI, or Looker when standard reporting on well-structured data is enough; build a custom BI dashboard when you need a proprietary data model, deep integration with your own systems, embedded analytics inside your applications, workflow actions triggered from the report, or role-based access rules those tools cannot express. Off-the-shelf BI tools are the fastest way to stand up standalone reporting, but they cap out on custom data models, embedded scenarios, and application-level access control — precisely where mid-market requirements tend to begin. A custom BI dashboard is production software you own, built to your data and your workflows rather than rented against a per-seat license. Many companies run both: a packaged tool for ad-hoc analysis, and a custom BI dashboard for the governed, embedded, or operational reporting the packaged tool cannot handle.
What Is the Difference Between a BI Dashboard and a Data Visualization Tool
A data visualization tool draws charts from data you hand it, while a business intelligence dashboard is a full application that consolidates the data, models it, controls who sees what, and delivers reporting on a schedule. They differ in scope: a visualization tool is a chart library you feed an extract, whereas a BI dashboard is an engineered reporting application with a data layer of its own. That data layer is the second difference — bring-your-own-spreadsheet versus data warehouse integration and an OLAP model that keeps every metric consistent. Governance is the third: a visualization widget has none, while a BI dashboard enforces role-based access and audit over who sees which data. A custom BI dashboard is production-grade software, not a visualization widget bolted onto an export.
Next Steps
A business intelligence dashboard is the reporting and analysis layer your teams rely on — consolidated data, OLAP-modeled metrics, drill-down, interactive filtering, scheduled reporting, and embedded analytics — developed and integrated as production software over the systems you already run, not a chart pasted over a spreadsheet export. Business intelligence dashboard development is engineering work, and Kavara builds, integrates, and deploys BI dashboards for mid-market companies as one part of our custom web application development services for data-driven companies, alongside SaaS, portal, and enterprise software builds.
Every BI dashboard we build starts by inventorying your data sources, defining the KPIs that matter, and scoping the analytical model underneath them. Talk to Kavara to start a discovery conversation and scope your business intelligence dashboard.