How Much Does Custom Web Application Development Cost
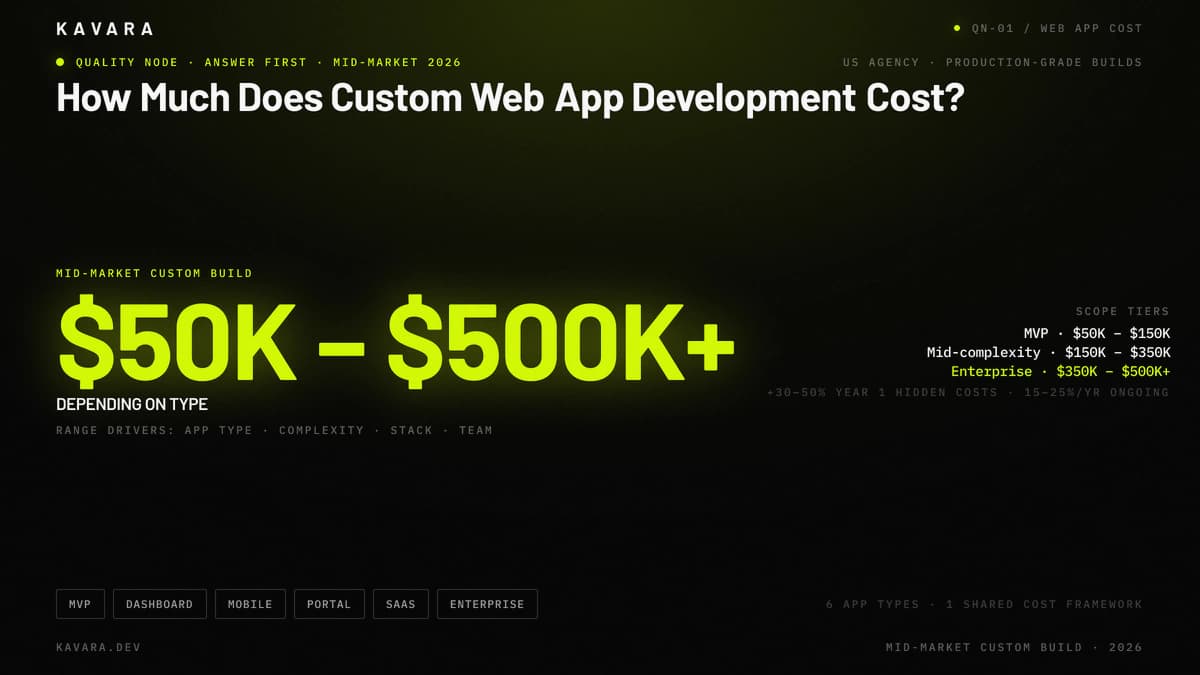
Custom web application development costs between $50,000 and $500,000 or more depending on application type, feature complexity, technology requirements, and team composition. These cost ranges reflect US-based agency rates for production-grade development that includes design, architecture, development, quality assurance, deployment, and post-launch support. The variation in custom web application development cost is not arbitrary — a simple MVP with core functionality and a complex multi-tenant SaaS platform with enterprise integrations are fundamentally different engineering efforts.
The diagram below summarizes the dominant cost range and the four primary drivers, with three scope tiers and six application-type chips for fast orientation.
Mid-market companies need accurate cost data to build realistic budgets and evaluate proposals. Clutch's 2026 verified software development review data reports an average project cost of $132,480.29 and a typical timeline of about 13 months; useful market context, but not enough for production-grade custom web application development budgets. This guide breaks that pattern with specific ranges by application type — SaaS platforms, enterprise portals, analytics dashboards, and MVPs — plus phase allocation, team comparisons, hidden costs, and an ROI framework.
Understanding these costs matters because custom web application development is a capital investment, not an expense line. The difference between a well-budgeted custom software development project and one that spirals comes down to scope clarity, team selection, and accounting for the full cost picture before writing the first line of code. Whether you plan to build web applications for customer-facing SaaS delivery, internal operations, or data-driven analytics, this guide provides the data you need to budget with confidence and launch production-grade software on schedule.
What Determines Custom Web Application Development Cost
The cost of custom web application development is determined by six primary factors that interact to define the total investment required for a production-ready application. Understanding these factors prevents budget surprises and helps mid-market companies evaluate production web application services with clarity.
Application Complexity is typically the single largest cost driver. A simple CRUD application with a few data models and standard user flows requires 500 to 1,000 development hours. A multi-service platform with real-time data processing, role-based access across multiple user types, and complex business logic can require 3,000 to 5,000 hours or more. Complexity increases non-linearly because each additional service layer introduces integration points, data dependencies, and testing surface area that compound development effort.
Closely tied to complexity is the breadth of functionality the application must deliver. Feature Scope directly correlates with development cost because each feature requires design, frontend implementation, backend logic, testing, and documentation. Adding ten features does not cost ten times a single feature — it costs more, because interactions between features create additional complexity. A payment processing feature in isolation is straightforward. That same feature interacting with subscription billing, usage metering, refund workflows, and tax calculation becomes a subsystem requiring careful architecture.
The tools and frameworks used to build these features also affect development cost. Technology Stack affects cost through development speed, talent availability, and operational complexity. The right technology stack selection balances development speed, long-term maintenance cost, and team availability. Native mobile development costs more than cross-platform approaches. Microservices architectures require more DevOps infrastructure than monolithic deployments. AI and machine learning integration adds data pipeline and model-serving costs on top of standard development.
Technology selection matters, but the engineers making those selections matter equally. Team Composition varies cost by rate and efficiency. Senior engineers command higher hourly rates but typically deliver faster, write fewer bugs, and make better architectural decisions that reduce downstream costs. The difference between a team of senior engineers and a team of junior developers is not just speed — it is the quality of decisions made at the architecture level that compound over the life of the application.
While team composition affects how well the application is engineered, the design layer determines how well users interact with it. Design Requirements range from template-based UI implementation to comprehensive UX research programs with custom design systems, accessibility compliance, and multi-device responsive optimization. Custom design adds $25,000 to $80,000 depending on scope, but well-designed applications see higher adoption rates and lower support costs post-launch.
Beyond the application itself, most custom web applications must connect to the systems and services that surround them. Integration Complexity measures the number and difficulty of connections to third-party services, legacy systems, and external data sources. Each integration requires API development, authentication handling, error management, and ongoing maintenance as external systems evolve. Data migration from legacy systems adds further cost when historical records must be transformed, validated, and loaded into new data structures.
These six factors interact differently depending on the type of application being built — a SaaS platform, an enterprise portal, a data dashboard, or an MVP each carry distinct cost profiles based on how these factors combine.
Web Application Development Cost by Application Type
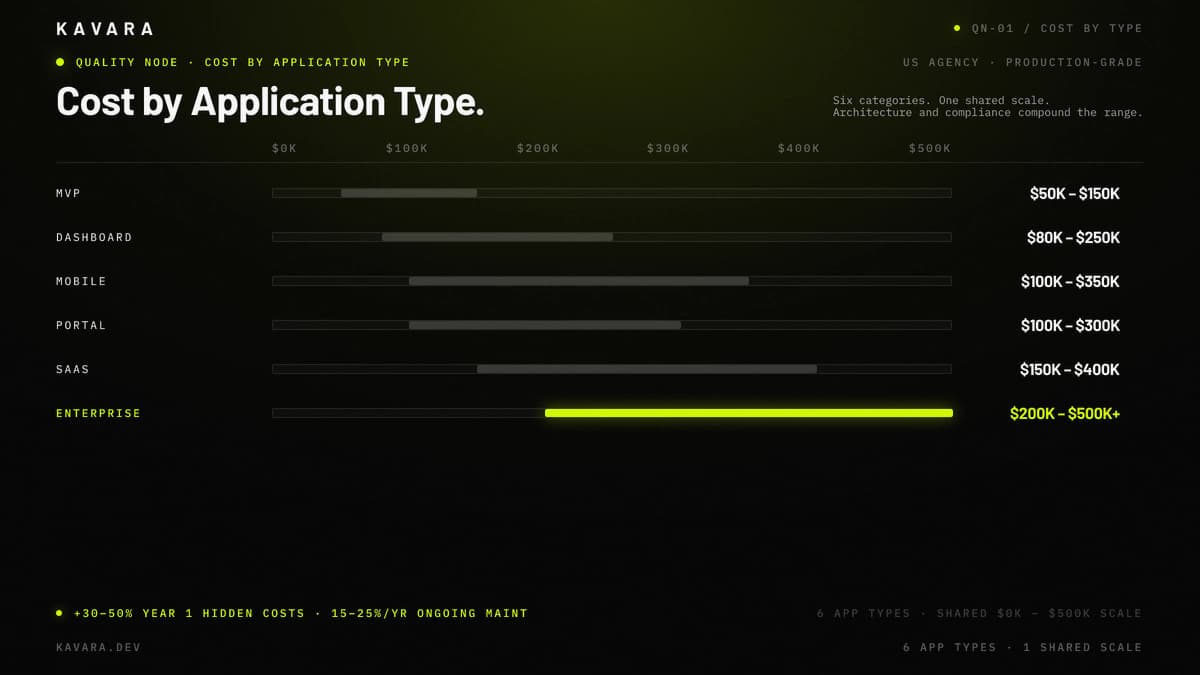
Custom web application development costs vary dramatically by application type because each category carries different architectural requirements, compliance needs, and integration demands. The following table summarizes typical ranges based on US-agency rates for production-grade development.
| Application Type | Complexity | Typical Cost Range | Timeline |
|---|---|---|---|
| MVP / Proof of Concept | Low–Medium | $50,000 – $150,000 | 2–4 months |
| SaaS Application | Medium–High | $150,000 – $400,000 | 4–10 months |
| Enterprise Portal | Medium–High | $100,000 – $300,000 | 3–8 months |
| Dashboard / Analytics App | Medium | $80,000 – $250,000 | 3–7 months |
| Enterprise Software | High | $200,000 – $500,000+ | 6–12+ months |
| Mobile Application | Medium–High | $100,000 – $350,000 | 3–9 months |
These ranges assume a US-based development team delivering web application development services with full design, QA, and deployment phases included. Companies that build web applications with extensive compliance requirements, complex integrations, or enterprise-scale data processing fall toward the upper end of each range.
SaaS Application Development Cost
SaaS application development costs $150,000 to $400,000 or more for production-grade platforms. Multi-tenancy — one shared codebase serving many isolated customer accounts — and subscription billing add 25% to 40% premium over standard web applications, with cost concentrating in backend architecture, tenant data isolation, billing workflows, and automated provisioning. See our SaaS development cost breakdown for tier-by-tier ranges, phase allocation, and SaaS-specific cost drivers.
Enterprise Portal Development Cost
Enterprise portal development costs between $100,000 and $300,000 depending on portal type, integration requirements, and user management complexity. Portal development cost varies primarily based on the number of user roles, document management needs, and the depth of integration with existing enterprise systems.
Client portals with document sharing, communication channels, and billing visibility typically require $100,000 to $180,000. Employee portals and intranet platforms with HR system integration, knowledge bases, and workflow automation range from $120,000 to $200,000. Vendor and partner portals with procurement workflows, compliance tracking, and performance monitoring cost $150,000 to $300,000 due to multi-organization data management and complex access control requirements.
Portal cost escalates when SSO integration spans multiple identity providers, when role-based access requires granular permission matrices, and when the portal must connect to existing ERP, CRM, or HRIS platforms through custom API layers. Learn more about our enterprise web portal development services and how we architect portals for security and scalability.
Dashboard and Analytics Application Cost
Dashboard and analytics application development costs between $80,000 and $250,000 depending on data source complexity, real-time requirements, and visualization sophistication. Dashboard development cost scales primarily with the volume and variety of data sources feeding the platform and the latency requirements for data freshness.
Standard BI dashboards querying relational databases with charting, filtering, and export functionality require $80,000 to $130,000. Real-time monitoring dashboards using WebSocket connections and streaming data pipelines range from $130,000 to $200,000. Complex analytics platforms with machine-learning-powered insights, predictive models, and custom visualization components cost $200,000 to $250,000 or more.
Data source complexity, custom visualization needs, concurrent user load, and the number of distinct user roles with different data access permissions drive dashboard costs toward the upper range. Mid-market companies should evaluate whether off-the-shelf BI tools like Tableau or Power BI meet their needs before investing in custom dashboard development. Custom dashboards are justified when existing tools cannot handle proprietary data models, real-time requirements, or embedded analytics within other applications. See our approach to custom analytics development for details on data architecture and visualization.
MVP Development Cost
MVP development costs $50,000 to $150,000 depending on feature scope, design polish, and whether compliance architecture (HIPAA, SOC 2, SSO) is required from the validation audience. Cost is controlled by feature prioritization and proven technology choices, not by cutting architecture quality. For tier-by-tier breakdowns (validation, launch-ready, enterprise), phase allocation, and MVP-specific hidden costs, see our MVP development cost breakdown.
Regardless of application type, custom web application development cost distributes across the same core phases — and understanding where the money goes within each phase is essential for accurate budgeting.
Web Application Development Cost by Development Phase
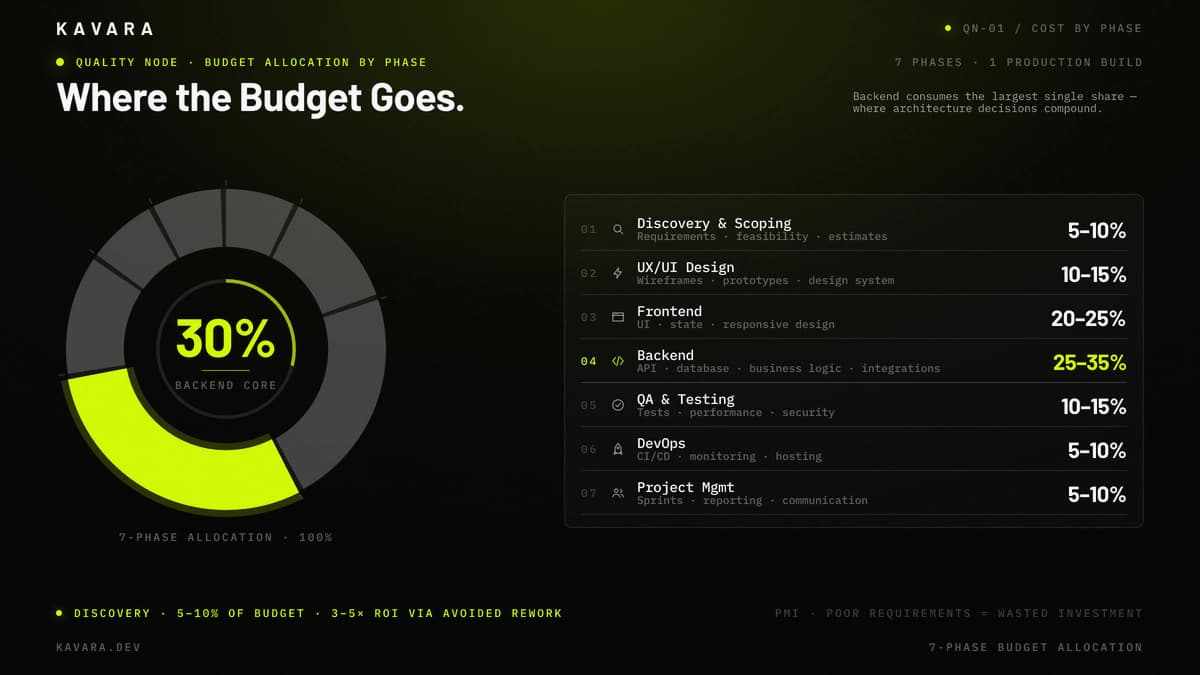
Custom web application development investment distributes across seven phases, each consuming a predictable percentage of the total budget. Understanding this distribution reveals that building a web application involves far more than coding — and that skipping phases creates hidden costs downstream. PMI's 2026 Pulse of the Profession report found that nearly one-third of complex projects fail, more than twice the 13% failure rate for projects overall, which makes phase discipline a budget-control issue rather than project-management ceremony.
The donut chart below shows how budget distributes across the seven development phases, with backend as the largest slice.
| Phase | % of Total Budget | What It Includes | Why It Matters |
|---|---|---|---|
| Discovery & Scoping | 5–10% | Requirements, user research, feasibility, estimates | Prevents costly scope changes later |
| UX/UI Design | 10–15% | Research, wireframes, prototypes, design system | Reduces development rework and increases adoption |
| Frontend Development | 20–25% | UI implementation, state management, responsive design | User-facing quality determines product success |
| Backend Development | 25–35% | API, database, business logic, integrations | Core functionality and data architecture |
| QA & Testing | 10–15% | Automated tests, manual testing, performance, security | Prevents expensive post-launch bugs |
| DevOps & Infrastructure | 5–10% | CI/CD, hosting, monitoring, security configuration | Ensures reliable deployment and operations |
| Project Management | 5–10% | Sprint planning, communication, reporting | Keeps project on track and within budget |
Backend development consumes the largest share because it encompasses the application's core logic, data architecture, API layer, scalability patterns, and all integrations with external systems. Architecture decisions made during backend development determine whether the application can scale to handle growing user loads without costly re-engineering. The Consortium for Information & Software Quality's 2022 report estimated the US cost of poor software quality at $2.41 trillion and accumulated technical debt at approximately $1.52 trillion. Architecture and QA spend should be planned before code quality debt becomes operating cost. Frontend development takes the second-largest share because production-grade user interfaces require responsive design across devices, complex state management, and performance optimization that directly affects user experience.
Discovery and scoping consume only 5 to 10 percent of total budget, yet they can produce the highest return of any phase by preventing the scope changes and architectural rework that cause cost overruns in custom development. Discovery is a high-ROI investment in a development project because it turns assumptions into reviewed requirements before design, architecture, and engineering spend begins.
QA and testing represents another phase that companies sometimes attempt to reduce. That is usually false economy. Defects found after release cost more to fix because they can affect users, production data, support volume, and downstream features simultaneously. Each phase has specific deliverables and checkpoints — see our process methodology for the complete methodology, timeline, and communication structure.
The cost of each development phase also depends on who performs the work — and the team model a company selects has as much impact on total project cost as the phases themselves.
How Team Model Affects Development Cost
Team model selection affects custom web application development cost as much as feature scope because hourly rate, communication overhead, and quality variance interact to determine total cost of ownership. Total cost of ownership is the complete cost to build, manage, revise, launch, and maintain the application across the full engagement, not only the hourly development invoice. The four primary models carry materially different rate ranges:
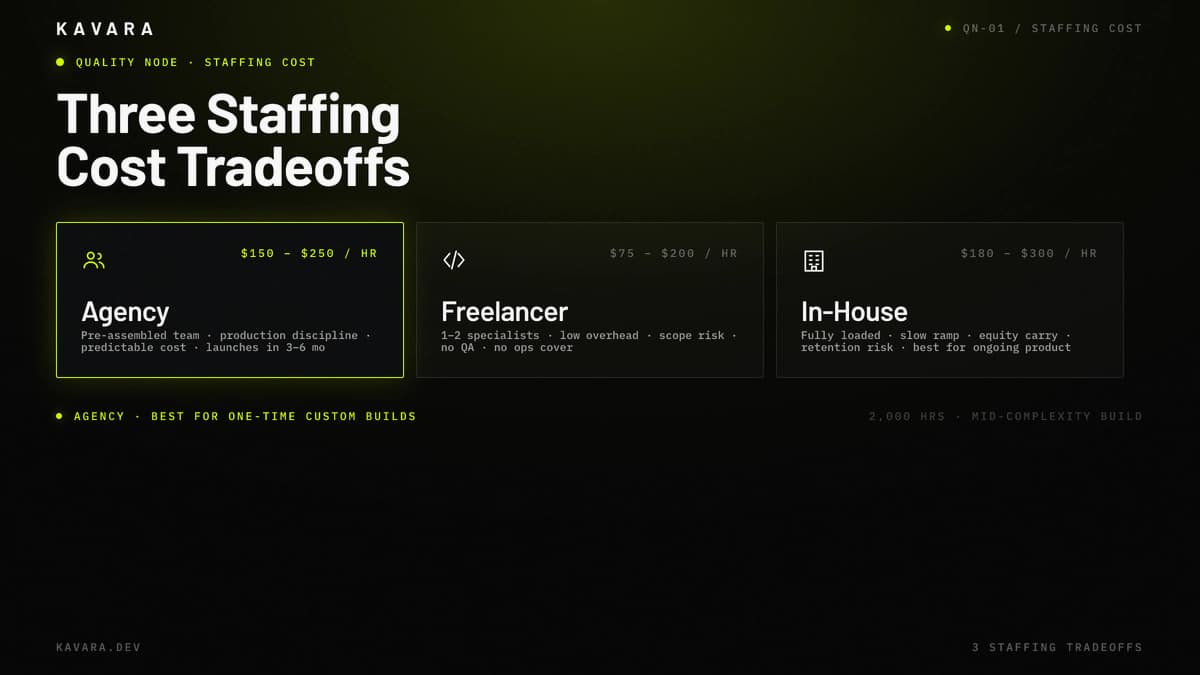
The comparison below contrasts the three staffing models — agency, freelancer, and in-house — on hourly cost and ramp dynamics.
| Team Model | Typical Hourly Rate (US) |
|---|---|
| US Agency | $150–$250/hr |
| Freelancers | $75–$200/hr |
| Offshore Agency | $30–$80/hr |
| In-House Team | $180–$300/hr (fully loaded) |
US agencies cost more per hour than offshore teams or many freelancers, but the rate includes project management, QA, DevOps coverage, architecture accountability, and delivery coordination. Freelancers fit narrow specialist tasks, while offshore agencies require stricter documentation, timezone overlap, acceptance criteria, and review discipline. In-house teams provide control for continuous product needs, but recruiting, benefits, management overhead, and idle capacity make them expensive for one-time builds.
Lower hourly rates do not automatically produce lower total cost. Management overhead, rework rates, ramp-up time, recruiting cost, and quality variance combine into total cost of ownership that often inverts the apparent savings from a lower rate. The U.S. Bureau of Labor Statistics reported a May 2024 median annual wage of $133,080 for software developers. Its December 2025 Employer Costs for Employee Compensation release reported private-industry benefits at $13.79 per hour on top of $32.36 in wages, which explains why fully loaded in-house engineering cost lands well above salary alone. The full TCO analysis includes freelancer management overhead, offshore rework exposure, in-house recruiting and ramp-up costs, and project-type recommendations. Read the team model cost comparison for that deeper model.
Team model and hourly rate are only part of the total cost equation. Beyond the initial development investment, a set of hidden costs affects total project economics that most estimates fail to account for.
Hidden Costs of Web Application Development
Beyond the initial development investment, these costs impact total project economics and represent the most common source of budget surprises for mid-market companies building custom web applications.
The cost map below identifies the six Year-1 categories — third-party services, maintenance, iteration, scaling, compliance, and training — that add 30 to 50 percent to the build invoice.
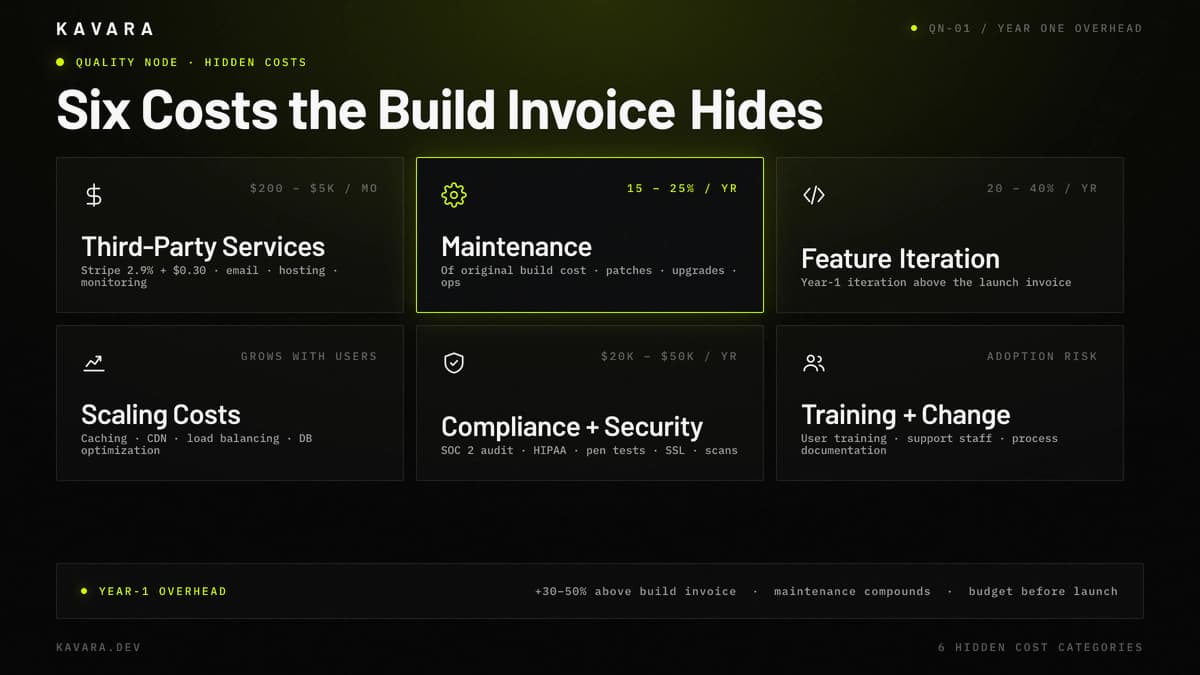
1. Third-Party Services — Production applications depend on paid services that accumulate monthly. Stripe's standard domestic card pricing is 2.9% plus $0.30 per successful transaction, and payment fees compound directly with transaction volume. Transactional email services cost $50 to $500 per month depending on volume. Cloud hosting for production applications ranges from $500 to $5,000 or more per month based on compute, storage, and data transfer requirements. Monitoring, logging, CDN, and search services add $200 to $1,000 monthly.
2. Ongoing Maintenance — Bug fixes, security patches, dependency updates, and infrastructure management typically cost 15 to 25 percent of the initial development investment annually. ADEVS's 2026 software-maintenance pricing benchmark places active-use maintenance near 15 to 25 percent of the original development budget per year. A $250,000 application requires $37,500 to $62,500 per year in baseline maintenance to remain secure, performant, and compatible with evolving browser and platform requirements.
3. Feature Iteration — Post-launch feature development based on user feedback and market response should be budgeted at 20 to 40 percent of the initial build cost for Year 1. Custom applications generate the most value when they evolve based on real usage data rather than remaining static after launch.
4. Scaling Costs — Infrastructure costs increase as user bases grow. Database optimization, caching layer implementation, CDN expansion, and load balancing architecture add cost as applications move from hundreds to thousands to tens of thousands of concurrent users.
5. Compliance and Security — SSL certificates, annual penetration testing ($5,000 to $15,000), compliance audits, and HIPAA compliance implementation add significant ongoing cost for applications handling sensitive data. Vanta's SOC 2 cost guidance places typical audit fees at $10,000 to $50,000 and total SOC 2 readiness plus audit cost at $10,000 to $80,000 or more. IBM's 2025 Cost of a Data Breach Report puts the global average breach cost at $4.4 million. Security costs are an investment, not an expense — see our web application security best practices for how security architecture reduces long-term risk and cost.
6. Training, Content, and Change Management — Content creation, data migration from legacy systems, training data for AI features, API documentation, user-facing help documentation, user training programs, support staff onboarding, and organizational change management require investment that falls outside standard development estimates. Applications that launch without documentation and change management frequently underperform regardless of technical quality.
Budget for 30 to 50 percent above initial development cost to cover Year 1 hidden costs. This contingency protects against budget overruns and ensures the application receives the post-launch investment required to deliver its full business value.
Accounting for these hidden costs raises a natural question: with all of these expenses, how do mid-market companies justify custom web application development as an investment? The answer requires a structured ROI framework.
How to Calculate ROI for Custom Web Application Development
ROI for custom web application development is calculated by comparing the total cost of ownership against measurable business impact over a defined period. This framework transforms custom development from an abstract expense into a quantifiable investment with a projected payback timeline.
ROI = (Value Generated − Total Cost) ÷ Total Cost × 100
Value sources to quantify include revenue generated through new product lines or increased conversion rates, cost savings from eliminated manual labor, and consolidated tool subscription reductions. Additional value comes from risk reduction through improved compliance posture and competitive advantage from features that off-the-shelf tools cannot replicate. Each value source should be quantified with conservative estimates based on current operational data.
Total cost of ownership must include the initial development investment, Year 1 hidden costs (30 to 50 percent above initial estimate), and projected ongoing maintenance over a three-to-five-year horizon at 15 to 25 percent annually. This total cost figure represents the true denominator in the ROI equation and prevents the common mistake of calculating returns against development cost alone.
A mid-market company investing $250,000 in a custom operations portal that eliminates $210,000 per year in manual processing labor and reduces SaaS subscription costs by $50,000 per year generates $260,000 in annual value. Against a first-year total cost of approximately $337,500 (development plus hidden costs), this project achieves positive ROI within approximately 16 months. As the application scales to more users and processes, returns compound while marginal costs remain flat.
These same inputs become the budget assumptions that determine whether the project should proceed, shrink, or phase into multiple releases. But how does the ROI equation change when comparing custom development to off-the-shelf alternatives? The critical variable is time horizon. Off-the-shelf tools deliver value faster with lower initial cost, but per-seat licensing, customization limitations, and integration constraints erode their economic advantage over three to five years. The ROI equation differs significantly between custom and off-the-shelf solutions — see our custom software vs off-the-shelf comparison for TCO analysis across both approaches.
How to Budget for a Custom Web Application Project
Budgeting for a custom web application project requires a structured approach that accounts for both visible development costs and the hidden costs that most initial estimates miss. This six-step framework produces realistic budgets that survive contact with actual development.
Step 1: Define your scope tier. Identify whether your project falls into the MVP ($50,000 to $150,000), mid-complexity ($150,000 to $350,000), or enterprise ($350,000 to $500,000+) range based on feature requirements, compliance needs, and integration demands.
Step 2: Select your team model. Choose between agency, freelancer, or hybrid engagement based on project complexity, your internal technical capacity, and risk tolerance. Each model has different cost structures and total cost implications.
Step 3: Calculate the base development range using the application type and phase tables in this guide. Cross-reference your scope tier with your team model to establish an initial estimate range.
Step 4: Add 30 to 50 percent for hidden costs and contingency. This covers third-party services, post-launch iteration, infrastructure scaling, compliance costs, and the scope adjustments that occur in every project regardless of planning quality.
Step 5: Plan for ongoing annual costs at 15 to 25 percent of the initial build. Maintenance, hosting, security, and feature iteration are not optional — they are required to protect the initial investment.
Step 6: Structure phase-gate budgets rather than committing the full amount upfront. Approve discovery and design phases first, then authorize development based on refined estimates that incorporate discovery findings.
A clear web application requirements document is the foundation of accurate budget estimation. Projects that begin development without documented requirements experience the highest rates of cost overrun.
Is It Cheaper to Build a Web Application In-House or Outsource
Outsourcing is typically cheaper for one-time custom software development projects or when a company lacks existing technical leadership to manage a development team. Building in-house is cheaper long-term only when the company has ongoing product development needs that justify full-time engineering salaries, benefits, office space, and tooling.
The total cost of an in-house team extends beyond salary. Fully loaded cost per developer — including benefits, equipment, management overhead, recruiting fees, and office costs — reaches $180,000 to $300,000 annually per engineer in US markets. A five-person team costs $900,000 to $1,500,000 per year regardless of project volume. An agency engagement for a defined project costs a fraction of that commitment and ends when the project delivers.
For mid-market companies with periodic development needs rather than continuous product iteration, the agency vs in-house development comparison demonstrates that agency engagement typically produces lower total cost, faster delivery, and broader expertise access.
How Can You Reduce Web Application Development Cost Without Sacrificing Quality
Six strategies reduce custom web application development cost while maintaining production-grade standards:
- Start with an MVP — Validate your core hypothesis with minimal feature scope before committing full budget to speculative features. An MVP development approach lets you validate assumptions before committing full budget.
- Use proven technology stacks — Experimental frameworks carry higher development cost and introduce stability risk. Mature technologies have larger talent pools, better documentation, and fewer unexpected issues during development.
- Invest in discovery — Preventing rework through thorough requirements gathering costs far less than fixing architectural mistakes mid-development. Discovery phases typically return three to five times their cost in avoided rework.
- Prioritize features ruthlessly — The MoSCoW method separates must-haves from nice-to-haves. Cutting three low-priority features can reduce development cost by 20 to 30 percent without affecting core product value.
- Choose the right team model — Match your team model to project type and complexity level. Overpaying for simple tasks and underpaying for complex architecture both increase total cost.
- Do not skip QA — Production defects are more expensive than defects caught during testing because they add user impact, support handling, hotfix risk, and regression exposure. QA investment reduces total cost, not increases it.
These strategies reduce total cost by eliminating waste rather than cutting investment in the quality and testing that protect long-term value.
What Are the Ongoing Costs After Launching a Web Application
Ongoing costs for a custom web application typically run 15 to 25 percent of the initial development cost annually, covering hosting, maintenance, security updates, and feature iteration. A $200,000 application requires $30,000 to $50,000 per year to maintain at production quality.
Hosting and infrastructure costs range from $500 to $5,000 or more per month depending on compute requirements, database size, and traffic volume. Maintenance and updates — including bug fixes, dependency upgrades, and security patches — require $2,000 to $8,000 per month for production applications with active user bases. Feature development investment varies based on product roadmap priorities and user feedback but should be planned as part of annual technology budgets.
Post-launch support expectations vary by engagement model and development partner. For guidance on structuring ongoing relationships, see our guide on what to expect when working with a development company.
How Do Pricing Models Affect Total Development Cost
Pricing models distribute financial risk differently between client and development team, directly affecting total project cost and budget predictability for custom web application development.
Fixed price engagements work best when scope is well-defined before development begins. The development partner commits to a set deliverable at a set price, transferring scope risk to the provider. The trade-off is scope lock — changes during development trigger change orders that increase cost and delay timelines.
Time and materials pricing works best when requirements are likely to evolve during development. You pay for actual hours worked, retaining flexibility to adjust priorities sprint-by-sprint. The trade-off is open-ended budget exposure without disciplined scope management.
Retainer engagements work best for ongoing development with continuous feature delivery. Monthly investment stays predictable while scope flexes within each cycle. See our detailed fixed price vs time and materials pricing comparison for risk analysis and recommendations by project type.
How Much Does Mobile App Development Cost Compared to Web Applications
Mobile app development costs $100,000 to $350,000 for native iOS or Android applications and $80,000 to $250,000 for cross-platform development using React Native or Flutter. Mobile development cost exceeds equivalent web application cost because mobile requires platform-specific development, app store compliance, device-specific testing across screen sizes and operating system versions, and separate deployment pipelines. App store review processes also add one to three weeks to launch timelines, and rejection for compliance issues can delay deployment further — a hidden schedule cost that web applications avoid entirely.
Building both a web application and mobile application for the same product can save 20 to 30 percent over building them independently by sharing backend infrastructure, API layers, and business logic. This shared-backend architecture reduces redundant development and ensures data consistency across platforms.
For detailed mobile-specific pricing by platform and complexity tier, see our mobile app development cost guide.
Key Takeaways
Custom web application development costs between $50,000 and $500,000 or more, with application type and complexity serving as the primary cost drivers for mid-market companies investing in tailored software. Hidden costs add 30 to 50 percent to initial development estimates when accounting for hosting, maintenance, compliance, and post-launch iteration. ROI timelines for well-scoped custom development projects typically reach positive return within 12 to 18 months as cost savings and revenue gains compound.
Accurate budgeting starts with clear requirements documentation, realistic scope definition, and a team model matched to project complexity. Building custom web applications is a capital investment that pays returns when the project is scoped accurately, built by qualified engineers, and supported with ongoing maintenance and iteration after launch.
Kavara builds and launches custom web applications for mid-market companies across SaaS, portal, dashboard, and enterprise software categories. Contact us for a project scoping conversation and detailed estimate tailored to your application requirements. Explore our full custom web application development practice to see how we scale production software from concept through deployment and beyond.